Table of Contents
Reading and plotting data in Python with sunraster
sunraster is a sunpy-affiliated package designed for reading, manipulating and visualizing data taken with slit spectrograph instruments. This page explains how sunraster can be used with SPICE data.
To install sunraster, please follow the install instructions on the sunraster web page. Current SPICE files require sunraster version at least 0.4.3.
Read a SPICE file
- read_spice.py
from sunraster.instr.spice import read_spice_l2_fits

# example SPICE raster file (from STP122)
data_path = "/archive/SOLAR-ORBITER/SPICE"   # to be changed to your SPICE mirror
file_name = "fits/level2/2020/11/20/solo_L2_spice-n-ras_20201120T190711_V09_33554610-000.fits"
file_name = f"{data_path}/{file_name}"

raster = read_spice_l2_fits(file_name)
# raster is a NDCollection, containing a data cube per window:
# NDCollection
# ------------
# Cube keys: ('[STP122] O III 703 / Mg IX 706 - SH', '[STP122] O III 703 / Mg IX 706 - LH', '[STP122] S IV 750 - Peak', '[STP122] Ne VIII 770 / Mg VIII 772 - SH', '[STP122] Ne VIII 770 / Mg VIII 772 - LH', '[STP122] Ne VIII 780 / Mg VIII 782 - SH', '[STP122] Ne VIII 780 / Mg VIII 782 - LH', '[STP122] S V 786 / O IV 787 - Peak')
# Number of Cubes: 8
# Aligned dimensions: [1.0 784.0 160.0] pix
# Aligned world physical axis types: ('time', 'custom:pos.helioprojective.lat', 'custom:pos.helioprojective.lon')

# Select a window
window = raster["[STP122] S IV 750 - Peak"]
print(window)
# SpectrogramCube
# ---------------
# Time Period: ('2020-11-20T19:08:11.469', '2020-11-21T00:26:51.219')
# Instrument axes: ['raster scan' 'spectral' 'slit' 'slit step']
# Pixel dimensions: [  1  50 784 160] pix
# Longitude range: [-3.59999999e+02 -1.52684942e-06] deg
# Latitude range: [-0.14409652  0.10439698] deg
# Spectral range: [7.48328253e-08 7.53106586e-08] m
# Data unit: adu

print(window.wcs)
# WCS Keywords
#
# Number of WCS axes: 4
# CTYPE : 'HPLN-TAN'  'HPLT-TAN'  'WAVE'  'TIME'
# CRVAL : -0.020917762180222222  -0.019849788266444443  7.507174190000001e-08  9619.875
# CRPIX : 80.5  392.5  25.5  1.0
# PC1_1 PC1_2 PC1_3 PC1_4  : 0.998375086225  -0.0156421343739  0.0  0.0
# PC2_1 PC2_2 PC2_3 PC2_4  : 0.207592335445  0.998375086225  0.0  0.0
# PC3_1 PC3_2 PC3_3 PC3_4  : 0.0  0.0  1.0  0.0
# PC4_1 PC4_2 PC4_3 PC4_4  : -120.25  0.0  0.0  1.0
# CDELT : 0.0011111111111111111  0.00030500000000000004  9.751700000000001e-12  1.0
# NAXIS : 160  784  50  1

print(window.array_axis_physical_types)
# [('time',), ('em.wl',), ('custom:pos.helioprojective.lon', 'custom:pos.helioprojective.lat'), ('custom:pos.helioprojective.lon', 'custom:pos.helioprojective.lat', 'time')]

# Data can be accessed as a numpy array:
print(window.data.shape)
# (1, 50, 784, 160)
Plot a SPICE file
(to be run following the previous script)
- plot_spice1.py
import matplotlib.pyplot as plt

plt.figure()
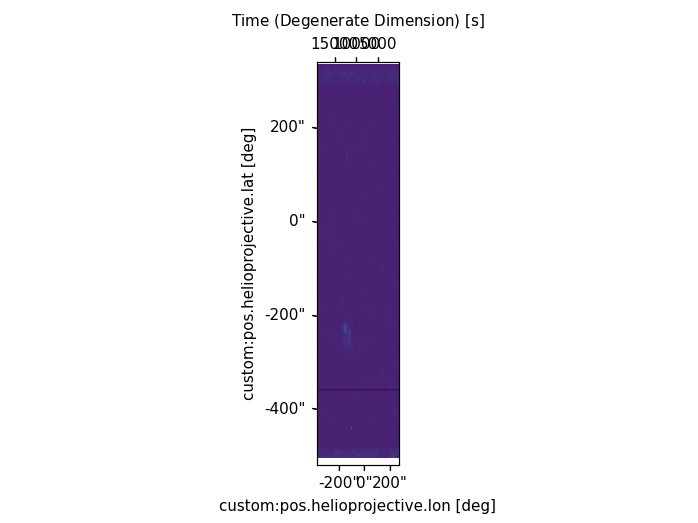
window[0, 24, :, :].plot()  # window central wavelength
plt.show()

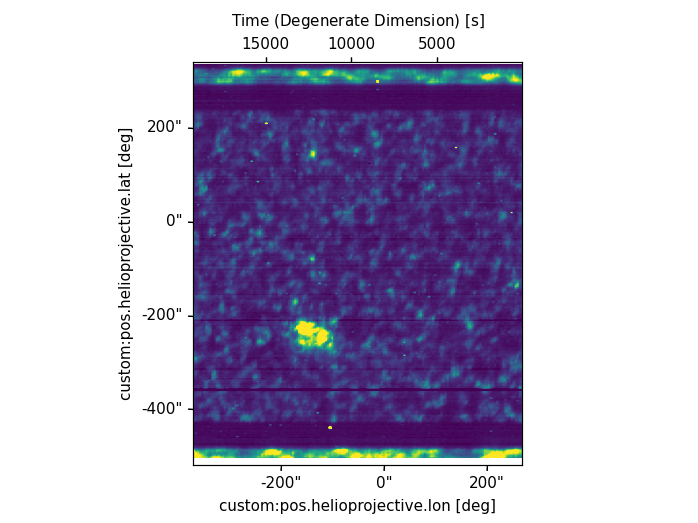
Some adjustments are still needed:
- for the 4“ slit and no Y-rebin, the aspect ratio is about 4
- color scale
- plot_spice2.py
plt.figure()
window[0, 24, :, :].plot(aspect=1/4, vmin=0, vmax=.3)
plt.show()

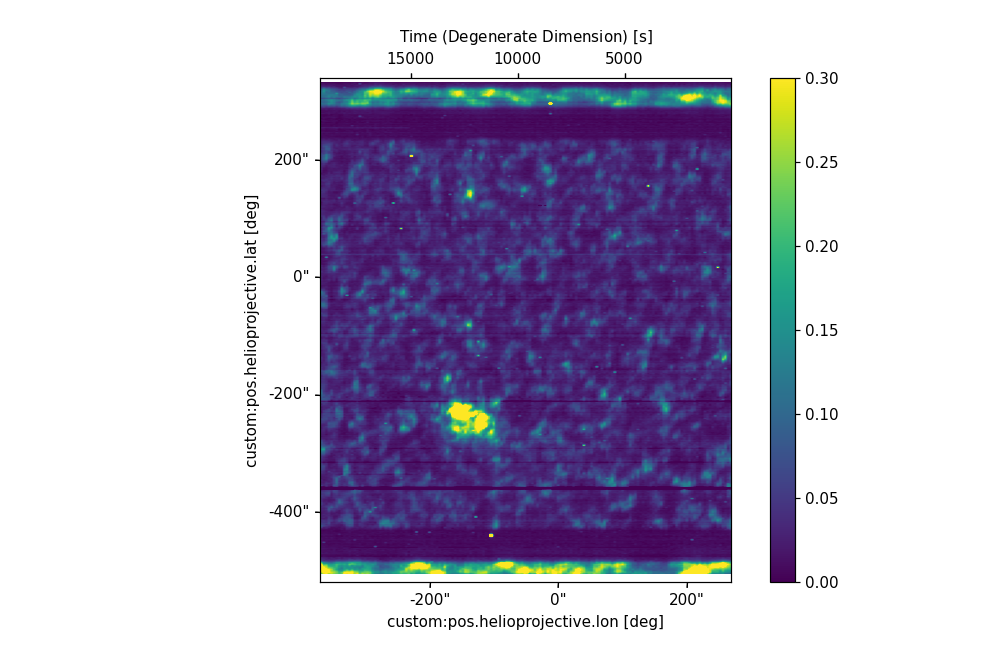
Adding a color bar:
- plot_spice3.py
plt.figure(figsize=(9,6))
ax = window[0, 24, :, :].plot(aspect=1/4, vmin=0, vmax=.3)
plt.colorbar(ax.get_images()[0])
plt.show()
